
| Hill Climbs of Southern Indiana | |||||
|---|---|---|---|---|---|
|
LOCATION See them all on one Google Map here. |
ROAD |
ELEV. CHANGE (Feet) |
DISTANCE (Miles) |
AVG.-STEEPEST GRADIENT* |
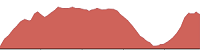
PROFILE (2 Miles) |
| Bethlehem | Beth-Washington | 294 (489-783) | 0.73 | 7.7% |  |
| C'town-Bethlehem | 279 (430-709) | 0.55 | 9.7% |  |
|
| Flint Ridge | 292 (430-722) | 0.62 | 9.0% |  |
|
| Miles | 315 (464-779) | 0.91 | 6.6% |  |
|
| Boone Township (So. Central Harrison Co.) |
Hwy 337 | NB: 143 (519-662) SB: 156 (509-665) |
NB: 0.49 SB: 0.48 |
NB: 5.5% - 7.7% SB: 6.1% - 19.0% |
 |
| Union Chapel | NB: 180 (469-649) SB: 171 (458-629) |
NB: 0.68 SB: 0.35 |
NB: 5.0% - 8.3% SB: 9.2% - 15.9% |
 |
|
| Borden | Daisy Hill | 204 (599-803) | 0.62 | 6.2% - 9+% |  |
| Dow Knob | 307 (549-856) | 0.50 | 11.8% - 15+% |  |
|
| Greenville-Borden | 237 (628-865) | 0.65 | 6.9% - 10+% |  |
|
| Jackson | 291 (587-878) | 0.58 | 9.5% |  |
|
| Martinsburg | 264 (591-855) | 0.53 | 9.5% |  |
|
| Star Valley | 389 (560-909) | 2.10 | 3.5% - 12.9% |  |
|
| Bridgeport | Doolittle Hill | 443 (461-904) | 0.68 | 12.4% - 18+% |  |
| Farnsley | Sect. 1 = 290 (480-770) Total = 442 (480-922) |
0.36 1.96 |
15.6% - 22+% 4.3% |
 |
|
| Bunker Hill (Hwy 160) |
Bunker Hill | EB: 82 (837-919) WB: 94 (825-919) |
EB: 0.17 WB: 0.19 |
EB: 9.5% WB: 9.6% |
 |
| Charlestown | Blue Ridge (Orchard) |
203 (500-703) | 0.57 | 6.8% - 12.0% |  |
| Bull Creek | 217 (475-692) | 0.43 | 9.5% |  |
|
| Tunnel Mill | EB: 133 (447-580) WB: 159 (440-599) |
EB: 0.23 WB: 0.30 |
EB: 11.2% WB: 10.1% |
 |
|
| Waterline | 147 (443-590) | 1.59 | 1.8% |  |
|
| Corydon | Mathis | 308 (500-808) | 0.51 | 11.5% |  |
| Valley View | Top Sect. = 188 (695-883) Total = 344 (539-883) |
0.47 1.06 |
7.7% 6.2% |
 |
|
| Elizabeth | Hwy. 211 | 363 (465-828) | 0.81 |
8.6% |
 |
| Seven Springs (South Bound) |
Climb 1 = 102 (710-812) Climb 2 = 105 (707-812) |
0.53 0.22 |
3.6% 9.1% |
 |
|
| Stoner Hill | Sect. 1 = 221 (460-681) Total = 419 (437-856) |
0.43 1.35 |
9.8% 5.9% |
 |
|
| Evans Landing (So. Harrison Co.) |
Rabbit Hash | 235 (497-732) | 0.45 | 10.1% |  |
| Georgetown | Hamby | 70 (668-738) | 0.22 | 6.0% |  |
| Henryville | Fire Tower (Clark St. Forest) |
281 (660-941) | 0.38 | 14.2% - 22+% |  |
| Flatwood | 118 (834-952) | 0.22 | 10.3% |  |
|
| Hwy. 160 | 107 (724-831) | 0.37 | 5.5% |  |
|
| Pixley | 173 (702-875) | 0.21 | 15.8% |  |
|
| Pixley + Flatwood | 289 (695-984) | 1.56 | 3.5% |  |
|
| Laconia | Mosquito Creek | EB: 240 (471-711) WB: 244 (479-723) |
EB: 0.69 WB: 0.56 |
EB: 6.6% WB: 8.3% |
 |
| Lanesville | Ball Diamond from Lanesville |
#1: 170 (713-883) #2: 139 (723-862) |
#1: 0.71 #2: 0.41 |
#1: 4.5% #2: 6.4% |
 |
| St. John's Church | 88 (769-857) | 0.41 | 4.1% |  |
|
| St. John's Church - Black Creek |
NB: 160 (692-852) SB: 180 (672-858) |
NB: 0.62 SB: 0.82 |
NB: 4.9% SB: 4.3% |
 |
|
| Leavenworth (Crawford County) |
Main Street (Old to New L'worth) |
140 (468-608) | 0.20 | 13.6% |  |
| Wyandotte Cave | 423 (410-833) | 1.10 | 7.3% |  |
|
| Madison | Hwy 56 | 362 (441-803) | 1.39 | 4.9% |  |
| Hwy 7 (a.k.a. Hanging Rock) |
324 (491-815) | 0.90 | 6.8% |  |
|
| Michigan Rd | 390 (491-871) | 0.90 | 8.2% |  |
|
| Telegraph Hill | 316 (516-832) | 0.67 | 8.9% |  |
|
| Dugans Hollow | 422 (484-906) | 1.85 | 4.3% |  |
|
| Memphis | Bartle Knob | 395 (588-983) | 1.13 | 6.6% - 9+% |  |
| New Albany | Blunk Knob | Sect. 1 = 376 (457-833) Total = 494 (457-951) |
1.05 1.91 |
6.8% 4.9% |
 |
| Camp Street (Profile: ⇑ Camp, ⇓ Cherry) |
154 (461-615) | 0.28 | 10.4% |  |
|
| Cherry Street (Profile: ⇑ Cherry, ⇓ Camp) |
148 (482-630) | 0.28 | 10.1% |  |
|
| Corydon Pike (a.k.a. Edwardsville Hill) |
336 (604-940) | 1.21 | 5.3% |  |
|
| Corydon Pike (a.k.a. Edwardsville Hill) |
190 (476-666) | 0.28 | 12.9% |  |
|
| Old Vincennes | 282 (610-892) | 0.84 | 6.4% |  |
|
| Spring Hill (Profile: ⇑ Spring Hill, ⇓ Cherry) |
222 (415-637) | 0.32 | 13.2% |  |
|
| New Boston (So. Harrison Co.) |
Old Dam 43 | 267 (401-668) | 0.66 | 7.7% |  |
| New Liberty (Scott County) |
Liberty Knob | 118 (687-805) | 0.23 | 9.8% |  |
| Rosewood (So. Harrison Co.) |
Rosewood | 338 (502-840) | 0.98 | 6.5% |  |
| Salem (Washington County) |
Old Hwy. 56 | 266 (695-961) | 1.06 | 4.8% |  |
| Scottsburg | Leota | 283 (717-1000) | 0.80 | 6.7% |  |
| St. Joseph | Atkins (South Bound) |
115 (839-954) | 0.20 | 11.2% |  |
| Fairview Knob | 364 (607-971) | 0.57 | 12.2% |  |
|
| St. Joe (a.k.a. Dug Knob) |
333 (615-948) | 0.59 | 10.8% - 18+% |  |
|
| St. Marys Floyds Knobs |
Banet | 127 (805-932) | 0.27 | 8.9% |  |
| Freiberger | 123 (792-915) | 0.31 | 7.7% - 11+% |  |
|
| Moser (Green Valley) |
396 (580-976) | 1.01 | 7.4% |  |
|
| Paoli Pike | 349 (534-883) | 1.26 | 5.3% |  |
|
| Spickert Knob (West Bound) |
381 (540-921) | 0.98 | 7.4% |  |
|
|
* Notes:
|
|||||
Want to add to, edit or correct this information?
Email webmaster here!